|
FINDING ORDERS OF REACTION EXPERIMENTALLY
This page is an introduction to some of the experimental methods that can be used in school labs to find orders of reaction. There are two fundamentally different approaches to this - you can either investigate what happens to the initial rate of the reaction as you change concentrations, or you can follow a particular reaction all the way through, and process the results from that single reaction. We will look at these two approaches separately. Don't expect full practical details. This is going to be a very long page. I wouldn't really recommend that you try to read it all in one go. Initial rate experiments How initial rate experiments work An outline of the experiments The simplest initial rate experiments involve measuring the time taken for some easily recognisable event to happen very early on in a reaction. This could include the time taken for, say, 5 cm3 of gas to be produced. Or it could be the time taken for a small measurable amount of precipitate to be formed. Or you could measure the time taken for some dramatic colour change to occur. We will look at examples of all these below. You then change the concentration of one of the components of the reaction, keeping everything else constant - the concentrations of other reactants, the total volume of the solution and the temperature and so on. Then you find the time taken for the same event to take place with that new concentration. This is repeated for a range of concentrations of the substance you are interested in. You would need to cover a reasonably wide range of concentrations, taking perhaps 5 or so different concentrations varying from the original one down to half of it or less. Obviously, you could then repeat the process by changing something else - the concentration of a different substance, or the temperature, for example. Understanding the results We will take a simple example of an initial rate experiment where you have a gas being produced. This could be a reaction between a metal and an acid, for example, or the catalytic decomposition of hydrogen peroxide. If you plotted the volume of gas given off against time, you would probably get the first graph below. 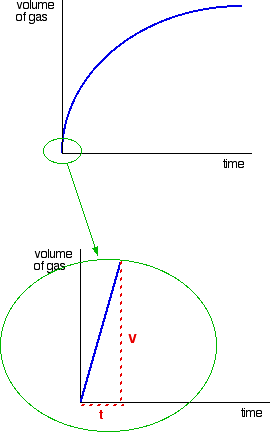 If you then look at the second graph, enlarging the very beginning of the first curve, you will see that it is approximately a straight line at that point. That is only a reasonable approximation if you are considering a very early stage in the reaction. The further into the reaction you go, the more the graph will start to curve. Measuring the slope of a straight line is very easy. The slope in this case is simply V/t. Now suppose you did the experiment again with a different (lower) concentration of the reagent. Again, we will measure the time taken for the same volume of gas to be given off, and so we are still just looking at the very beginning of the reaction: 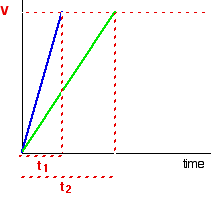
Suppose, for example, that instead of measuring the time taken to collect 5 cm3 of gas, you just collected the gas up to a mark which you had made on the side of a test tube. Does it matter? If you are simply wanting to compare initial rates, then it doesn't matter. If you look at the expressions in the table above, you should recognise that the initial rate is inversely proportional to the time taken. In symbols: You can then plot 1/t as a measure of rate against the varying concentrations of the reactant you are investigating. If the reaction is first order with respect to that substance, then you would get a straight line. That's because in a first order reaction, the rate is proportional to the concentration. 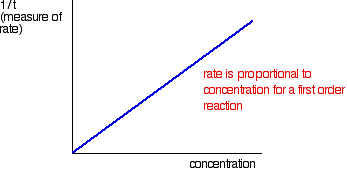 The best way around this is to plot what is known as a "log graph". The maths of this might not be familiar to you, but you may find that you are asked to do this as a part of a practical exam or practical exercise. If it is an exam, you would probably be given help as to how to go about it. The maths goes like this: If you have a reaction involving A, with an order of n with respect to A, the important part of the rate equation says: If you take the log of each side of the equation, you get: If you plotted log(rate) agains log[A], this second equation would plot as a straight line with slope n. If you measure the slope of this line, you get the order of the reaction. So you would convert all the values you had for rate into log(rate). Convert all the values for [A] into log[A], and then plot the graph. This should be a straight line. If it isn't, then you have done something wrong! Measure the slope to find the order, n. | |||||
|
Note: Don't worry if you don't understand logs (logarithms)! All you need to do is find the log button on your calculator and use it to convert your numbers. Practise to start with by trying to find log 2. It should give a value of 0.3010(etc). You probably have to enter 2 and then press the log button, but on some calculators it might be the other way around. If you do it the wrong way around, you will just get an error message. | |||||
|
Some sample reactions The catalytic decomposition of hydrogen peroxide This is a simple example of measuring the initial rate of a reaction producing a gas. A simple set-up to do this might be: 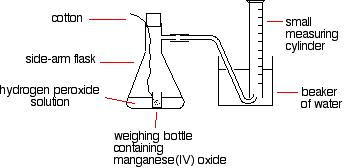 You have to find a way of adding the catalyst to the hydrogen peroxide solution without changing the volume of gas collected. If you added it to the flask using a spatula, and then quickly put the bung in, you might lose some gas before you got the bung in. Alternatively, as you pushed the bung in, you might force some air into the measuring cylinder. Either way, it makes your results meaningless. To start the reaction, you just need to shake the flask so that the weighing bottle falls over, and then continue shaking to make sure the catalyst mixes evenly with the solution. You could also use a special flask with a divided bottom, with the catalyst in one side, and the hydrogen peroxide solution in the other. They are easy to mix by tipping the flask. If you use a 10 cm3 measuring cylinder, initially full of water, you can reasonably accurately record the time taken to collect a small fixed volume of gas. You could, of course, use a small gas syringe instead. If you were looking at the effect of the concentration of hydrogen peroxide on the rate, then you would have to change its concentration, but keep everything else constant. The temperature would have to be kept constant, so would the total volume of the solution and the mass of manganese(IV) oxide. You would also have to be sure that the manganese(IV) oxide used always came from the same bottle so that its state of division was always the same. You could, of course, use much the same apparatus to find out what happened if you varied the temperature, or the mass of the catalyst, or the state of division of the catalyst. The thiosulphate-acid reaction If you add dilute hydrochloric acid to sodium thiosulphate solution, you get the slow formation of a pale yellow precipitate of sulphur. There is a very simple, but very effective, way of measuring the time taken for a small fixed amount of precipitate to form. Stand the flask on a piece of paper with a cross drawn on it, and then look down through the solution until the cross disappears. So . . . you put a known volume of sodium thiosulphate solution in a flask. Then you add a small known volume of dilute hydrochloric acid, start timing, swirl the flask to mix everything up, and stand it on the paper with the cross on. Time how long it takes for the cross to disappear. Then repeat using a smaller volume of sodium thiosulphate, but topped up to the same original volume with water. Everything else should be exactly as before. If you started with, say, 50 cm3 of sodium thiosulphate solution, you would repeat the experiment with perhaps, 40, 30, 20, 15 and 10 cm3 - each time made up to a total of 50 cm3 with water. The actual concentration of the sodium thiosulphate doesn't have to be known. In each case, you could record its relative concentration. The solution with 40 cm3 of sodium thiosulphate solution plus 10 cm3 of water has a concentration which is 80% of the original one, for example. The one with 10 cm3 of sodium thiosulphate solution plus 40 cm3 of water has a concentration which is 20% of the original one. When you came to plotting a rate against concentration graph, as we looked at further up the page, you would plot 1/t as a measure of the rate, and volume of sodium thiosulphate solution as a measure of concentration. Alternatively, you could plot relative concentrations - from, say, 20% to 100%. It doesn't actually matter - the shape of the graph will be identical. You could also look at the effect of temperature on this reaction, by warming the sodium thiosulphate solution before you added the acid. Take the temperature after adding the acid, though, because the cold acid will cool the solution slightly. This time you would change the temperature between experiments, but keep everything else constant. To get reasonable times, you would have to use a diluted version of your sodium thiosulphate solution. Using the full strength solution hot will produce enough precipitate to hide the cross almost instantly. Iodine clock reactions There are several reactions which go under the name "iodine clock". They are all reactions which give iodine as one of the products. This is the simplest of them, but only because it involves the most familiar reagents. The reaction we are looking at is the oxidation of iodide ions by hydrogen peroxide under acidic conditions. The iodine is formed first as a pale yellow solution darkening to orange and then dark red, before dark grey solid iodine is precipitated. There is a very clever way of picking out a when a particular very small amount of iodine has been formed. Iodine reacts with starch solution to give a very deep blue solution. If you added some starch solution to the reaction above, as soon as the first trace of iodine was formed, the solution would turn blue. That doesn't actually help! However, iodine also reacts with sodium thiosulphate solution. If you add a very small amount of sodium thiosulphate solution to your reaction mixture (including the starch solution), it will react with the iodine that is initially produced, and so the iodine won't affect the starch, and you won't get any blue colour. However, when that small amount of sodium thiosulphate has been used up, there is nothing to stop the next lot of iodine produced from reacting with the starch. The mixture suddenly goes blue. | |||||
|
Note: There is a neat piece of video on YouTube showing an iodine clock reaction (not necessarily the one I am talking about here, but it doesn't matter). It shows three reactions side by side:
| |||||
|
In our example, you could obviously look at the effect of changing
the hydrogen peroxide concentration, or the iodide ion concentration, or
the hydrogen ion concentration - each time, of course, keeping
everything else constant. That would let you find the orders with respect to everything taking part in the reaction. Following the course of a single reaction Rather than doing a whole set of initial rate experiments, you can also get information about orders of reaction by following a particular reaction from start to finish. There are two different ways you can do this. You can take samples of the mixture at intervals and do titrations to find out how the concentration of one of the reagents is changing. Or (and this is much easier!) you can measure some physical property of the reaction which changes as the reaction continues - for example, the volume of gas produced. We need to look at these two different approaches separately. Sampling the reaction mixture Bromoethane reacts with sodium hydroxide solution as follows: During the course of the reaction, both bromoethane and sodium hydroxide will get used up. However, it is relatively easy to measure the concentration of the sodium hydroxide at any one time by doing a titration with some standard acid - for example, with hydrochloric acid of a known concentration. You start with known concentrations of sodium hydroxide and bromoethane, and usually it makes sense to have them both the same. Because the reaction is 1:1, if the concentrations start the same as each other, they will stay the same as each other all through the reaction. So all you need to do is to take samples using a pipette at regular intervals during the reaction, and titrate them with standard hydrochloric acid in the presence of a suitable indicator. That is a lot easier said than done! The problem is that the reaction will still be going on in the time it takes for you to do the titration. And, of course, you only get one attempt at the titration. By the time you take another sample, the concentration of everything will have changed! There are two ways around this. You can slow the reaction down by diluting it, adding your sample to a larger volume of cold water before you do the titration. Then do the titration as quickly as possible. That's most effective if you are doing your reaction at a temperature above room temperature. Cooling it as well as diluting it will slow it down even more. But if possible (and it is possible in the case we are talking about) it is better to stop the reaction completely before you do the titration. In this case, you can stop it by adding the sample to a known volume (chosen to be an excess) of standard hydrochloric acid. That will use up all the sodium hydroxide in the mixture so that the reaction stops. Now you would titrate the resulting solution with standard sodium hydroxide solution, so that you can find out how much hydrochloric acid is left over in the mixture. That lets you calculate how much was used up, and so how much sodium hydroxide must have been present in the original reaction mixture. This sort of technique is known as a back titration. These calculations can be quite confusing to do without some guidance. If you are interested, you will find back titrations discussed on pages 72-75 of my chemistry calculations book. Processing the results You will end up with a set of values for concentration of (in this example) sodium hydroxide against time. The concentrations of the bromoethane are, of course, the same as these if you started with the same concentrations of each reagent. You can plot these values to give a concentration-time graph which will look something like this: 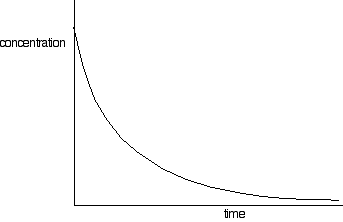 You need to find the rates of reaction at a number of points on the graph, and you do this by drawing tangents to the graph, and measuring their slopes.  The quickest way to go on from here is to plot a log graph as described further up the page. You would convert all your rates into log(rate), and all the concentrations into log(concentration). Then plot log(rate) against log(concentration). The slope of the graph gives you the order of reaction. 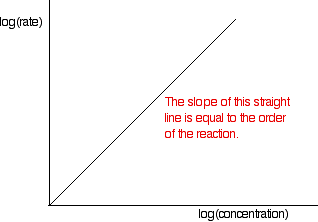 Notice that this is the overall order of the reaction - not just the order with respect to the reagent whose concentration you were measuring. The rate of reaction was falling because the concentrations of both of the reactants were falling. | |||||
Tuesday, 24 September 2013
FINDING ORDERS OF REACTION EXPERIMENTALLY
Subscribe to:
Post Comments (Atom)
No comments:
Post a Comment