|
MASS SPECTRA - THE MOLECULAR ION (M+) PEAK
This page explains how to find the relative formula mass (relative
molecular mass) of an organic compound from its mass spectrum. It also
shows how high resolution mass spectra can be used to find the molecular
formula for a compound. Using a mass spectrum to find relative formula mass The formation of molecular ions When the vaporised organic sample passes into the ionisation chamber of a mass spectrometer, it is bombarded by a stream of electrons. These electrons have a high enough energy to knock an electron off an organic molecule to form a positive ion. This ion is called the molecular ion. | ||||||||||||||||||||||||||||||||||||||||||||||||||||
|
Note: If you aren't sure about how a mass spectrum is produced, it might be worth taking a quick look at the page describing how a mass spectrometer works. | ||||||||||||||||||||||||||||||||||||||||||||||||||||
The molecular ion is often given the symbol M+ or  - the dot in this second version represents the fact that somewhere in
the ion there will be a single unpaired electron. That's one half of
what was originally a pair of electrons - the other half is the electron
which was removed in the ionisation process.
- the dot in this second version represents the fact that somewhere in
the ion there will be a single unpaired electron. That's one half of
what was originally a pair of electrons - the other half is the electron
which was removed in the ionisation process.The molecular ions tend to be unstable and some of them break into smaller fragments. These fragments produce the familiar stick diagram. Fragmentation is irrelevant to what we are talking about on this page - all we're interested in is the molecular ion. | ||||||||||||||||||||||||||||||||||||||||||||||||||||
|
Note: If you are interested in a detailed look at fragmentation patterns you could follow this link. | ||||||||||||||||||||||||||||||||||||||||||||||||||||
|
Using the molecular ion to find the relative formula mass In the mass spectrum, the heaviest ion (the one with the greatest m/z value) is likely to be the molecular ion. A few compounds have mass spectra which don't contain a molecular ion peak, because all the molecular ions break into fragments. That isn't a problem you are likely to meet at A'level. For example, in the mass spectrum of pentane, the heaviest ion has an m/z value of 72. 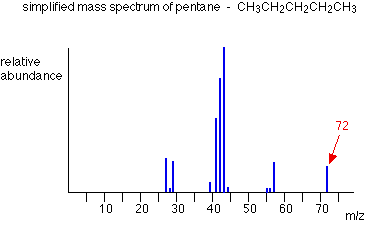 | ||||||||||||||||||||||||||||||||||||||||||||||||||||
|
Note: This mass spectrum has been drawn using data from the Spectral Data Base System for Organic Compounds (SDBS) at the National Institute of Materials and Chemical Research in Japan. It has been simplified by omitting all the minor lines with peak heights of 2% or less of the base peak (the tallest peak). | ||||||||||||||||||||||||||||||||||||||||||||||||||||
|
Because the largest m/z value is 72, that represents the largest ion
going through the mass spectrometer - and you can reasonably assume that
this is the molecular ion. The relative formula mass of the compound
is therefore 72. | ||||||||||||||||||||||||||||||||||||||||||||||||||||
|
Note: This assumes that the charge on the ion is 1+. That's always the case when you are interpreting these mass spectra. | ||||||||||||||||||||||||||||||||||||||||||||||||||||
|
Finding the relative formula mass (relative molecular mass) from a
mass spectrum is therefore trivial. Look for the peak with the highest
value for m/z, and that value is the relative formula mass of the
compound. There are, however, complications which arise because of the possibility of different isotopes (either of carbon or of chlorine or bromine) in the molecular ion. These cases are dealt with on separate pages. | ||||||||||||||||||||||||||||||||||||||||||||||||||||
|
Note: The presence of the carbon-13 isotope in a molecular ion causes a little peak 1 unit to the right of the M+ peak. This is called the M+1 peak. The presence of a chlorine atom in a compound causes two peaks in the molecular ion region - the M+ peak and the M+2 peak depending on whether the particular molecular ion contains a chlorine-35 or chlorine-37 isotope. Bromine creates a similar problem. Follow these links if you are interested - or explore them later via the mass spectrometry menu. | ||||||||||||||||||||||||||||||||||||||||||||||||||||
|
Using a mass spectrum to find a molecular formula
So far we've been looking at m/z values in a mass spectrum as whole
numbers, but it's possible to get far more accurate results using a high
resolution mass spectrometer. You can use that more accurate
information about the mass of the molecular ion to work out the
molecular formula of the compound. Accurate isotopic masses For normal calculation purposes, you tend to use rounded-off relative isotopic masses. For example, you are familiar with the numbers:
Using these accurate values to find a molecular formula Two simple organic compounds have a relative formula mass of 44 - propane, C3H8, and ethanal, CH3CHO. Using a high resolution mass spectrometer, you could easily decide which of these you had. On a high resolution mass spectrometer, the molecular ion peaks for the two compounds give the following m/z values:
A possible exam question A gas was known to contain only elements from the following list:
After a bit of playing around, you might reasonably come up with 3 gases which had relative formula masses of approximately 28 and which contained the elements from the list. They are N2, CO and C2H4. Working out their accurate relative formula masses gives:
In an exam, you would hope that - apart from the most simple cases - you would be given the possible formulae to work from. Trying to work out all the possible things which might add up to the value you want is quite time-consuming - and it's easy to miss an important possibility! | ||||||||||||||||||||||||||||||||||||||||||||||||||||
Showing posts with label Spectroscophy. Show all posts
Showing posts with label Spectroscophy. Show all posts
Tuesday, 1 October 2013
MASS SPECTRA - THE MOLECULAR ION (M+) PEAK

FRAGMENTATION PATTERNS IN THE MASS SPECTRA OF ORGANIC COMPOUNDS
|
FRAGMENTATION PATTERNS IN THE MASS SPECTRA OF ORGANIC COMPOUNDS
This page looks at how fragmentation patterns are formed when organic
molecules are fed into a mass spectrometer, and how you can get
information from the mass spectrum. The origin of fragmentation patterns The formation of molecular ions When the vaporised organic sample passes into the ionisation chamber of a mass spectrometer, it is bombarded by a stream of electrons. These electrons have a high enough energy to knock an electron off an organic molecule to form a positive ion. This ion is called the molecular ion - or sometimes the parent ion. | |||||||
|
Note: If you aren't sure about how a mass spectrum is produced, it might be worth taking a quick look at the page describing how a mass spectrometer works. | |||||||
|
The molecular ion is often given the symbol M+ or
- the dot in this second version represents the fact that somewhere in
the ion there will be a single unpaired electron. That's one half of
what was originally a pair of electrons - the other half is the electron
which was removed in the ionisation process. Fragmentation The molecular ions are energetically unstable, and some of them will break up into smaller pieces. The simplest case is that a molecular ion breaks into two parts - one of which is another positive ion, and the other is an uncharged free radical.   | |||||||
|
Note: A free radical is an atom or group of atoms which contains a single unpaired electron. More complicated break-ups are beyond the scope of A'level syllabuses. | |||||||
|
The uncharged free radical won't produce a line on the mass spectrum.
Only charged particles will be accelerated, deflected and detected by
the mass spectrometer. These uncharged particles will simply get lost
in the machine - eventually, they get removed by the vacuum pump. The ion, X+, will travel through the mass spectrometer just like any other positive ion - and will produce a line on the stick diagram. All sorts of fragmentations of the original molecular ion are possible - and that means that you will get a whole host of lines in the mass spectrum. For example, the mass spectrum of pentane looks like this: 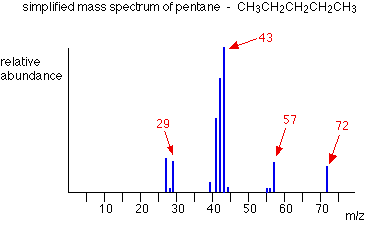 | |||||||
|
Note: All the mass spectra on this page have been drawn using data from the Spectral Data Base System for Organic Compounds (SDBS) at the National Institute of Materials and Chemical Research in Japan. They have been simplified by omitting all the minor lines with peak heights of 2% or less of the base peak (the tallest peak). | |||||||
|
It's important to realise that the pattern of lines in the mass
spectrum of an organic compound tells you something quite different from
the pattern of lines in the mass spectrum of an element. With an
element, each line represents a different isotope of that element. With a compound, each line represents a different fragment produced when the molecular ion breaks up. | |||||||
|
Note: If you are interested in the mass spectra of elements, you could follow this link. | |||||||
|
The molecular ion peak and the base peak In the stick diagram showing the mass spectrum of pentane, the line produced by the heaviest ion passing through the machine (at m/z = 72) is due to the molecular ion. | |||||||
|
Note: You have to be a bit careful about this, because in some cases, the molecular ion is so unstable that every single one of them splits up, and none gets through the machine to register in the mass spectrum. You are very unlikely to come across such a case at A'level. | |||||||
|
The tallest line in the stick diagram (in this case at m/z = 43) is called the base peak.
This is usually given an arbitrary height of 100, and the height of
everything else is measured relative to this. The base peak is the
tallest peak because it represents the commonest fragment ion to be
formed - either because there are several ways in which it could be
produced during fragmentation of the parent ion, or because it is a
particularly stable ion. Using fragmentation patterns This section will ignore the information you can get from the molecular ion (or ions). That is covered in three other pages which you can get at via the mass spectrometry menu. You will find a link at the bottom of the page. Working out which ion produces which line This is generally the simplest thing you can be asked to do. The mass spectrum of pentane Let's have another look at the mass spectrum for pentane: How many carbon atoms are there in this ion? There can't be 5 because 5 x 12 = 60. What about 4? 4 x 12 = 48. That leaves 9 to make up a total of 57. How about C4H9+ then? C4H9+ would be [CH3CH2CH2CH2]+, and this would be produced by the following fragmentation:  The methyl radical produced will simply get lost in the machine. The line at m/z = 43 can be worked out similarly. If you play around with the numbers, you will find that this corresponds to a break producing a 3-carbon ion:  The line at m/z = 29 is typical of an ethyl ion, [CH3CH2]+:  The other lines in the mass spectrum are more difficult to explain. For example, lines with m/z values 1 or 2 less than one of the easy lines are often due to loss of one or more hydrogen atoms during the fragmentation process. You are very unlikely to have to explain any but the most obvious cases in an A'level exam. The mass spectrum of pentan-3-one 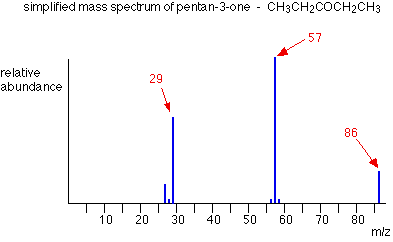 If you remember, the m/z = 57 peak in pentane was produced by [CH3CH2CH2CH2]+. If you look at the structure of pentan-3-one, it's impossible to get that particular fragment from it. Work along the molecule mentally chopping bits off until you come up with something that adds up to 57. With a small amount of patience, you'll eventually find [CH3CH2CO]+ - which is produced by this fragmentation:  You would get exactly the same products whichever side of the CO group you split the molecular ion. The m/z = 29 peak is produced by the ethyl ion - which once again could be formed by splitting the molecular ion either side of the CO group.  Peak heights and the stability of ions The more stable an ion is, the more likely it is to form. The more of a particular sort of ion that's formed, the higher its peak height will be. We'll look at two common examples of this. Examples involving carbocations (carbonium ions) | |||||||
|
Important! If you don't know what a carbocation (or carbonium ion) is, or why the various sorts vary in stability, it's essential that you follow this link before you go on. Use the BACK button on your browser to return quickly to this page. | |||||||
Summarizing the most important conclusion from the page on carbocations:
| |||||||
|
Note: The symbol "<" means "is less than". So what this is saying is that primary ions are less stable than secondary ones which in turn are less stable than tertiary ones. | |||||||
|
Applying the logic of this to fragmentation patterns, it means that a
split which produces a secondary carbocation is going to be more
successful than one producing a primary one. A split producing a
tertiary carbocation will be more successful still. Let's look at the mass spectrum of 2-methylbutane. 2-methylbutane is an isomer of pentane - isomers are molecules with the same molecular formula, but a different spatial arrangement of the atoms. 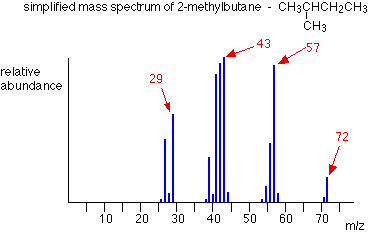  The ion formed is a secondary carbocation - it has two alkyl groups attached to the carbon with the positive charge. As such, it is relatively stable. The peak at m/z = 57 is much taller than the corresponding line in pentane. Again a secondary carbocation is formed - this time, by:  You would get the same ion, of course, if the left-hand CH3 group broke off instead of the bottom one as we've drawn it. In these two spectra, this is probably the most dramatic example of the extra stability of a secondary carbocation. Examples involving acylium ions, [RCO]+ Ions with the positive charge on the carbon of a carbonyl group, C=O, are also relatively stable. This is fairly clearly seen in the mass spectra of ketones like pentan-3-one. | |||||||
|
Note: There are lots of other examples of positive ions with extra stability and which are produced in large numbers in a mass spectrometer as a result. Without making this article even longer than it already is, it's impossible to cover every possible case. Check past exam papers to find out whether you are likely to need to know about other possibilities. If you haven't got past papers, follow the link on the syllabuses page to find out how to get hold of them. | |||||||
|
Using mass spectra to distinguish between compounds Suppose you had to suggest a way of distinguishing between pentan-2-one and pentan-3-one using their mass spectra.
In the pentan-2-one case, there are two different ions like this:
With pentan-3-one, you would only get one ion of this kind:
You don't need to worry about the other lines in the spectra - the 43, 57 and 71 lines give you plenty of difference between the two. The 43 and 71 lines are missing from the pentan-3-one spectrum, and the 57 line is missing from the pentan-2-one one. | |||||||
|
Note: Don't confuse the line at m/z = 58 in the pentan-2-one spectrum. That's due to a complicated rearrangement which you couldn't possibly predict at A'level. | |||||||
The two spectra look like this: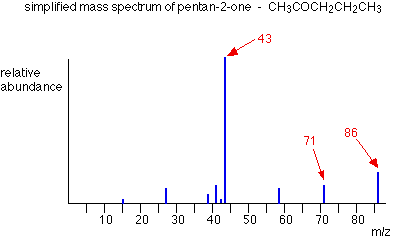 As you've seen, the mass spectrum of even very similar organic compounds will be quite different because of the different fragmentations that can occur. Provided you have a computer data base of mass spectra, any unkown spectrum can be computer analysed and simply matched against the data base. | |||||||
THE MASS SPECTRA OF ELEMENTS
|
THE MASS SPECTRA OF ELEMENTS
This page looks at the information you can get from the mass spectrum
of an element. It shows how you can find out the masses and relative
abundances of the various isotopes of the element and use that
information to calculate the relative atomic mass of the element. It also looks at the problems thrown up by elements with diatomic molecules - like chlorine, Cl2. The mass spectrum of monatomic elements Monatomic elements include all those except for things like chlorine, Cl2, with molecules containing more than one atom. The mass spectrum for boron 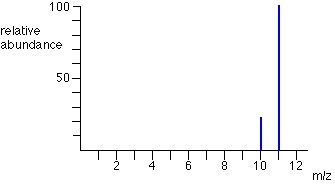 | |||||||||||||||||||||||
|
Note: If you need to know how this diagram is obtained, you should read the page describing how a mass spectrometer works. | |||||||||||||||||||||||
|
The number of isotopes The two peaks in the mass spectrum shows that there are 2 isotopes of boron - with relative isotopic masses of 10 and 11 on the 12C scale. | |||||||||||||||||||||||
|
Notes: Isotopes are atoms of the same element (and so with the same number of protons), but with different masses due to having different numbers of neutrons. We are assuming (and shall do all through this page) that all the ions recorded have a charge of 1+. That means that the mass/charge ratio (m/z) gives you the mass of the isotope directly. The carbon-12 scale is a scale on which the mass of the 12C isotope weighs exactly 12 units. | |||||||||||||||||||||||
|
The abundance of the isotopes The relative sizes of the peaks gives you a direct measure of the relative abundances of the isotopes. The tallest peak is often given an arbitrary height of 100 - but you may find all sorts of other scales used. It doesn't matter in the least. You can find the relative abundances by measuring the lines on the stick diagram. In this case, the two isotopes (with their relative abundances) are:
The relative atomic mass (RAM) of an element is given the symbol Ar and is defined as:
Suppose you had 123 typical atoms of boron. 23 of these would be 10B and 100 would be 11B. The total mass of these would be (23 x 10) + (100 x 11) = 1330 The average mass of these 123 atoms would be 1330 / 123 = 10.8 (to 3 significant figures). 10.8 is the relative atomic mass of boron. Notice the effect of the "weighted" average. A simple average of 10 and 11 is, of course, 10.5. Our answer of 10.8 allows for the fact that there are a lot more of the heavier isotope of boron - and so the "weighted" average ought to be closer to that. The mass spectrum for zirconium 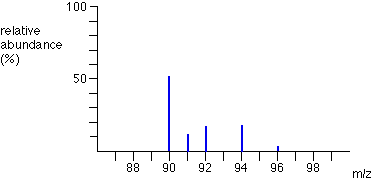 The 5 peaks in the mass spectrum shows that there are 5 isotopes of zirconium - with relative isotopic masses of 90, 91, 92, 94 and 96 on the 12C scale. The abundance of the isotopes This time, the relative abundances are given as percentages. Again you can find these relative abundances by measuring the lines on the stick diagram. In this case, the 5 isotopes (with their relative percentage abundances) are:
| |||||||||||||||||||||||
|
Note: You almost certainly wouldn't be able to measure these peaks to this degree of accuracy, but your examiners may well give you the data in number form anyway. We'll do the sum with the more accurate figures. | |||||||||||||||||||||||
|
Working out the relative atomic mass Suppose you had 100 typical atoms of zirconium. 51.5 of these would be 90Zr, 11.2 would be 91Zr and so on. | |||||||||||||||||||||||
|
Note: If you object to the idea of having 51.5 atoms or 11.2 atoms and so on, just assume you've got 1000 atoms instead of 100. That way you will have 515 atoms, 112 atoms, etc. Most people don't get in a sweat over this, and just use the numbers as they are! | |||||||||||||||||||||||
|
The total mass of these 100 typical atoms would be (51.5 x 90) + (11.2 x 91) + (17.1 x 92) + (17.4 x 94) + (2.8 x 96) = 9131.8 The average mass of these 100 atoms would be 9131.8 / 100 = 91.3 (to 3 significant figures). 91.3 is the relative atomic mass of zirconium. | |||||||||||||||||||||||
|
Note: If you want further examples of calculating relative atomic masses from mass spectra, you might like to refer to my book, Calculations in A level Chemistry. | |||||||||||||||||||||||
|
The mass spectrum of chlorine
Chlorine is taken as typical of elements with more than one atom per
molecule. We'll look at its mass spectrum to show the sort of problems
involved. Chlorine has two isotopes, 35Cl and 37Cl, in the approximate ratio of 3 atoms of 35Cl to 1 atom of 37Cl. You might suppose that the mass spectrum would look like this: 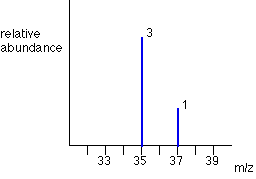 The problem is that chlorine consists of molecules, not individual atoms. When chlorine is passed into the ionisation chamber, an electron is knocked off the molecule to give a molecular ion, Cl2+. These ions won't be particularly stable, and some will fall apart to give a chlorine atom and a Cl+ ion. The term for this is fragmentation.  If the Cl atom formed isn't then ionised in the ionisation chamber, it simply gets lost in the machine - neither accelerated nor deflected. The Cl+ ions will pass through the machine and will give lines at 35 and 37, depending on the isotope and you would get exactly the pattern in the last diagram. The problem is that you will also record lines for the unfragmented Cl2+ ions. Think about the possible combinations of chlorine-35 and chlorine-37 atoms in a Cl2+ ion. Both atoms could be 35Cl, both atoms could be 37Cl, or you could have one of each sort. That would give you total masses of the Cl2+ ion of:
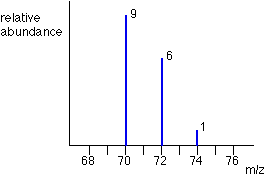 The relative heights of the 70, 72 and 74 lines are in the ratio 9:6:1. If you know the right bit of maths, it's very easy to show this. If not, don't worry. Just remember that the ratio is 9:6:1. What you can't do is make any predictions about the relative heights of the lines at 35/37 compared with those at 70/72/74. That depends on what proportion of the molecular ions break up into fragments. That's why you've got the chlorine mass spectrum in two separate bits so far. You must realise that the vertical scale in the diagrams of the two parts of the spectrum isn't the same. The overall mass spectrum looks like this: 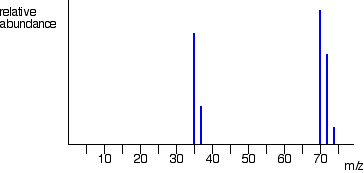 | |||||||||||||||||||||||
|
| |||||||||||||||||||||||
Subscribe to:
Posts (Atom)


