Mass Spectrometry
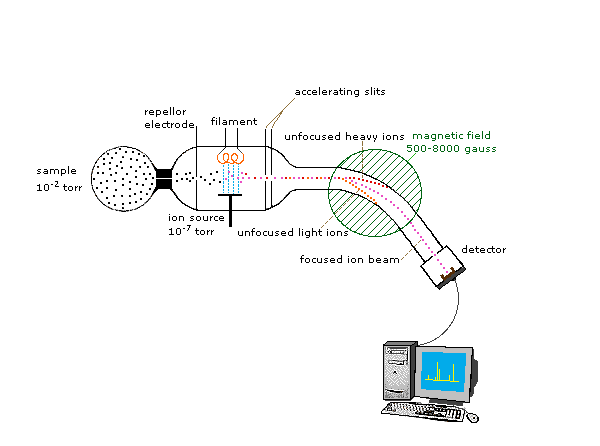
In order to measure the characteristics of individual molecules, a mass spectrometer converts them to ions so that they can be moved about and manipulated by external electric and magnetic fields. The three essential functions of a mass spectrometer, and the associated components, are:
2. The ions are sorted and separated according to their mass and charge. The Mass Analyzer
3. The separated ions are then measured, and the results displayed on a chart. The Detector

2. The Nature of Mass Spectra
A mass spectrum will usually be presented as a vertical bar graph, in which each bar represents an ion having a specific mass-to-charge ratio (m/z) and the length of the bar indicates the relative abundance of the ion. The most intense ion is assigned an abundance of 100, and it is referred to as the base peak. Most of the ions formed in a mass spectrometer have a single charge, so the m/z value is equivalent to mass itself. Modern mass spectrometers easily distinguish (resolve) ions differing by only a single atomic mass unit (amu), and thus provide completely accurate values for the molecular mass of a compound. The highest-mass ion in a spectrum is normally considered to be the molecular ion, and lower-mass ions are fragments from the molecular ion, assuming the sample is a single pure compound.
The following diagram displays the mass spectra of three simple gaseous compounds, carbon dioxide, propane and cyclopropane. The molecules of these compounds are similar in size, CO2 and C3H8 both have a nominal mass of 44 amu, and C3H6 has a mass of 42 amu. The molecular ion is the strongest ion in the spectra of CO2 and C3H6, and it is moderately strong in propane. The unit mass resolution is readily apparent in these spectra (note the separation of ions having m/z=39, 40, 41 and 42 in the cyclopropane spectrum). Even though these compounds are very similar in size, it is a simple matter to identify them from their individual mass spectra. By clicking on each spectrum in turn, a partial fragmentation analysis and peak assignment will be displayed. Even with simple compounds like these, it should be noted that it is rarely possible to explain the origin of all the fragment ions in a spectrum. Also, the structure of most fragment ions is seldom known with certainty.

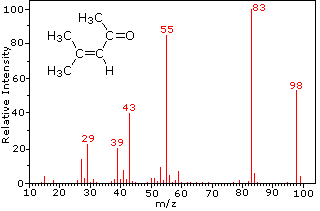
Most stable organic compounds have an even number of total electrons, reflecting the fact that electrons occupy atomic and molecular orbitals in pairs. When a single electron is removed from a molecule to give an ion, the total electron count becomes an odd number, and we refer to such ions as radical cations. The molecular ion in a mass spectrum is always a radical cation, but the fragment ions may either be even-electron cations or odd-electron radical cations, depending on the neutral fragment lost. The simplest and most common fragmentations are bond cleavages producing a neutral radical (odd number of electrons) and a cation having an even number of electrons. A less common fragmentation, in which an even-electron neutral fragment is lost, produces an odd-electron radical cation fragment ion. Fragment ions themselves may fragment further. As a rule, odd-electron ions may fragment either to odd or even-electron ions, but even-electron ions fragment only to other even-electron ions. The masses of molecular and fragment ions also reflect the electron count, depending on the number of nitrogen atoms in the species.
| Ions with no nitrogen or an even # N atoms | odd-electron ions even-number mass | even-electron ions odd-number mass |
|---|---|---|
| Ions having an odd # N atoms | odd-electron ions odd-number mass | even-electron ions even-number mass |
 |
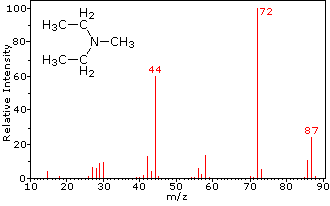 | |
| 4-methyl-3-pentene-2-one | N,N-diethylmethylamine |
|---|
3. Isotopes
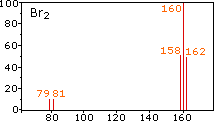
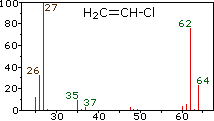
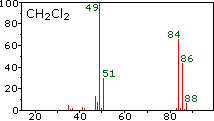
Since a mass spectrometer separates and detects ions of slightly different masses, it easily distinguishes different isotopes of a given element. This is manifested most dramatically for compounds containing bromine and chlorine, as illustrated by the following examples. Since molecules of bromine have only two atoms, the spectrum on the left will come as a surprise if a single atomic mass of 80 amu is assumed for Br. The five peaks in this spectrum demonstrate clearly that natural bromine consists of a nearly 50:50 mixture of isotopes having atomic masses of 79 and 81 amu respectively. Thus, the bromine molecule may be composed of two 79Br atoms (mass 158 amu), two 81Br atoms (mass 162 amu) or the more probable combination of 79Br-81Br (mass 160 amu). Fragmentation of Br2 to a bromine cation then gives rise to equal sized ion peaks at 79 and 81 amu.
|  |  | ||
| bromine | vinyl chloride | methylene chloride |
|---|
Chlorine: 75.77% 35Cl and 24.23% 37Cl
Bromine: 50.50% 79Br and 49.50% 81Br
The presence of chlorine or bromine in a molecule or ion is easily detected by noticing the intensity ratios of ions differing by 2 amu. In the case of methylene chloride, the molecular ion consists of three peaks at m/z=84, 86 & 88 amu, and their diminishing intensities may be calculated from the natural abundances given above. Loss of a chlorine atom gives two isotopic fragment ions at m/z=49 & 51amu, clearly incorporating a single chlorine atom. Fluorine and iodine, by contrast, are monoisotopic, having masses of 19 amu and 127 amu respectively. It should be noted that the presence of halogen atoms in a molecule or fragment ion does not change the odd-even mass rules given above.
To make use of a calculator that predicts the isotope clusters for different combinations of chlorine, bromine and other elements Click Here. This application was developed at Colby College.
| ||||||||||||
|---|---|---|---|---|---|---|---|---|---|---|---|---|
The calculator on the right may be used to calculate the isotope contributions to ion abundances 1 and 2 amu greater than the molecular ion (M). Simply enter an appropriate subscript number to the right of each symbol, leaving those elements not present blank, and press the "Calculate" button. The numbers displayed in the M+1 and M+2 boxes are relative to M being set at 100%.
4. Fragmentation Patterns
The fragmentation of molecular ions into an assortment of fragment ions is a mixed blessing. The nature of the fragments often provides a clue to the molecular structure, but if the molecular ion has a lifetime of less than a few microseconds it will not survive long enough to be observed. Without a molecular ion peak as a reference, the difficulty of interpreting a mass spectrum increases markedly. Fortunately, most organic compounds give mass spectra that include a molecular ion, and those that do not often respond successfully to the use of milder ionization conditions. Among simple organic compounds, the most stable molecular ions are those from aromatic rings, other conjugated pi-electron systems and cycloalkanes. Alcohols, ethers and highly branched alkanes generally show the greatest tendency toward fragmentation.
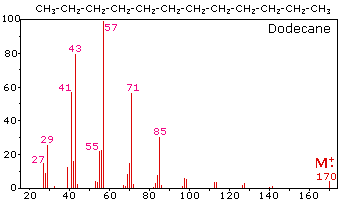
The mass spectrum of dodecane on the right illustrates the behavior of an unbranched alkane. Since there are no heteroatoms in this molecule, there are no non-bonding valence shell electrons. Consequently, the radical cation character of the molecular ion (m/z = 170) is delocalized over all the covalent bonds. Fragmentation of C-C bonds occurs because they are usually weaker than C-H bonds, and this produces a mixture of alkyl radicals and alkyl carbocations. The positive charge commonly resides on the smaller fragment, so we see a homologous series of hexyl (m/z = 85), pentyl (m/z = 71), butyl (m/z = 57), propyl (m/z = 43), ethyl (m/z = 29) and methyl (m/z = 15) cations. These are accompanied by a set of corresponding alkenyl carbocations (e.g. m/z = 55, 41 &27) formed by loss of 2 H. All of the significant fragment ions in this spectrum are even-electron ions. In most alkane spectra the propyl and butyl ions are the most abundant.
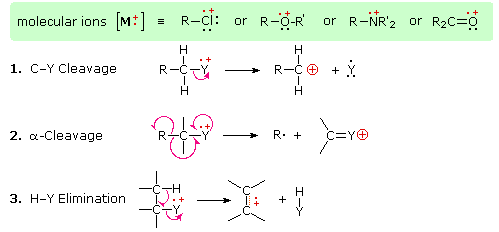
The presence of a functional group, particularly one having a heteroatom Y with non-bonding valence electrons (Y = N, O, S, X etc.), can dramatically alter the fragmentation pattern of a compound. This influence is thought to occur because of a "localization" of the radical cation component of the molecular ion on the heteroatom. After all, it is easier to remove (ionize) a non-bonding electron than one that is part of a covalent bond. By localizing the reactive moiety, certain fragmentation processes will be favored. These are summarized in the following diagram, where the green shaded box at the top displays examples of such "localized" molecular ions. The first two fragmentation paths lead to even-electron ions, and the elimination (path #3) gives an odd-electron ion. Note the use of different curved arrows to show single electron shifts compared with electron pair shifts.
|
|
Odd-electron fragment ions are often formed by characteristic rearrangements in which stable neutral fragments are lost. Mechanisms for some of these rearrangements have been identified by following the course of isotopically labeled molecular ions. A few examples of these rearrangement mechanisms may be seen by clicking the following button.
|
In assigning mass values to atoms and molecules, we have assumed integral values for isotopic masses. However, accurate measurements show that this is not strictly true. Because the strong nuclear forces that bind the components of an atomic nucleus together vary, the actual mass of a given isotope deviates from its nominal integer by a small but characteristic amount (remember E = mc2). Thus, relative to 12C at 12.0000, the isotopic mass of 16O is 15.9949 amu (not 16) and 14N is 14.0031 amu (not 14).
| Formula | C6H12 | C5H8O | C4H8N2 |
|---|---|---|---|
| Mass | 84.0939 | 84.0575 | 84.0688 |
Tables of precise mass values for any molecule or ion are available in libraries; however, the mass calculator provided below serves the same purpose. Since a given nominal mass may correspond to several molecular formulas, lists of such possibilities are especially useful when evaluating the spectrum of an unknown compound. Composition tables are available for this purpose, and a particularly useful program for calculating all possible combinations of H, C, N & O that give a specific nominal mass has been written by Jef Rozenski. To use this calculator
No comments:
Post a Comment