|
THE TREND FROM NON-METAL TO METAL IN THE GROUP 4 ELEMENTS
This page explores the trend from non-metallic to metallic behaviour
in the Group 4 elements - carbon (C), silicon (Si), germanium (Ge), tin
(Sn) and lead (Pb). It describes how this trend is shown in the
structures and physical properties of the elements, and finally makes a
not entirely successful attempt to explain the trend. Structures and Physical Properties Structures of the elements The trend from non-metal to metal as you go down the Group is clearly seen in the structures of the elements themselves. Carbon at the top of the Group has giant covalent structures in its two most familiar allotropes - diamond and graphite. | |
|
Allotropes: Two or more forms of the same element in the same physical state. The structures of diamond and graphite are explored in more detail on a page about giant covalent structures in another part of this site. It would probably be worth your while to read this page before you go any further. Use the BACK button on your browser to return quickly to this page. | |
Diamond has a three-dimensional structure of carbon atoms each joined
covalently to 4 other atoms. The diagram shows a small part of that
structure.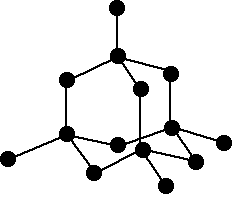 The common allotrope of tin ("white tin" or "beta-tin") is metallic and has its atoms held together by metallic bonds. The structure is a distorted close-packed arrangement. In close-packing, each atom is surrounded by 12 near-neighbours. By the time you get to lead, the atoms are arranged in a straightforward 12-co-ordinated metallic structure. | |
|
Note: If you aren't sure about metallic bonding or metallic structures, you should follow these links before you go any further. The first link will actually lead you to the second one if you want to explore both of these topics. Use the BACK button on your browser to return to this page. | |
|
There is therefore a clear trend from the typical covalency found in
non-metals to the metallic bonding in metals, with the change-over
obvious in the two entirely different structures found in tin. Physical properties of the elements Melting points and boiling points If you look at the trends in melting and boiling points as you go down Group 4, it is very difficult to make any sensible comments about the shift from covalent to metallic bonding. The trends reflect the increasing weakness of the covalent or metallic bonds as the atoms get bigger and the bonds get longer. 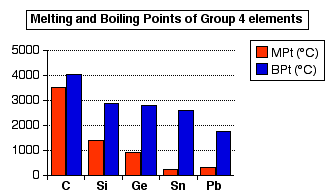 | |
|
Note: The data in this chart comes from the University of Sheffield's excellent Webelements site. There is an awful lot of variability in the data depending on where you get it from. I have to admit to choosing this set because it shows simple, largely unbroken patterns! | |
|
Brittleness There is a much clearer non-metal / metal difference shown if you look at the brittleness of the elements. Carbon as diamond is, of course, very hard - reflecting the strength of the covalent bonds. However, if you hit it with a hammer, it shatters. Once you apply enough energy to break the existing carbon-carbon bonds, that's it! Silicon, germanium and grey tin (all with the same structure as diamond) are also brittle solids. However, white tin and lead have metallic structures. The atoms can roll over each other without any permanent disruption of the metallic bonds - leading to typical metallic properties like being malleable and ductile. Lead in particular is a fairly soft metal. Electrical conductivity Carbon as diamond doesn't conduct electricity. In diamond the electrons are all tightly bound and not free to move. | |
|
Note: In graphite, each atom donates one electron to a delocalised system of electrons which takes in the whole of its layer. These electrons are free to move around, and so graphite conducts electricity - but this is a special case. If you are interested, the bonding in graphite is like a vastly extended version of the bonding in benzene. Each carbon atom undergoes sp2 hybridisation, and then the unhybridised p orbitals on each carbon atom overlap sideways to give a massive pi system above and below the plane of the sheet of atoms. | |
|
Unlike diamond (which doesn't conduct electricity), silicon, germanium and grey tin are semiconductors. | |
|
Semiconductors: The theory of semiconductors lies outside A level chemistry, but briefly . . . When lots of atoms come together to make a giant structure, their atomic orbitals merge to produce a huge number of molecular orbitals, which arrange themselves in bands of increasing energy. One of these is often described as a valence band. The molecular orbitals in this band hold the electrons which make up the normal covalent (or metallic) bonding. The other band is called the conductance band. This usually has a higher energy than the valence band, and in something like diamond or silicon at absolute zero, the conductance band is empty of electrons. However, as electrons gain thermal energy as the temperature increases, some electrons may jump from the valence band into the conductance band - especially if the gap between the two is small. Once they are in the conductance band, they are delocalised from their original atoms and are free to move and conduct electricity. In diamond, the energy gap between the valence band and conductance band is too high for this to happen. In silicon, the band gap is small enough for electrons to jump, and so silicon is a semiconductor. If you are interested in this, you might like to try a Google search on silicon semiconductors band theory (or similar). | |
|
White tin and lead are normal metallic conductors of electricity. There is therefore a clear trend from the typically non-metallic conductivity behaviour of carbon as diamond, and the typically metallic behaviour of white tin and lead. Trying to explain the trends The main characteristic of metals is that they form positive ions. What we need to do is to look at the factors which increase the likelihood of positive ions being formed as you go down Group 4. Electronegativity Electronegativity is a measure of the tendency of an atom to attract a bonding pair of electrons. It is usually measured on the Pauling scale, where the most electronegative element (fluorine) is given an electronegativity of 4. The lower the electronegativity of an atom, the less strongly the atom attracts a bonding pair of electrons. That means that this atom will tend to lose the electron pair towards whatever else it is attached to. The atom we are interested in will therefore tend to carry either a partial positive charge or form a positive ion. Metallic behaviour is usually associated with a low electronegativity. | |
|
Note: If you aren't sure about electronegativity you really ought to read about it before you go any further. Use the BACK button on your browser to return quickly to this page. | |
So what happens to electronegativity in Group 4? Does it decrease as
you go down the Group, suggesting a trend towards metallic behaviour?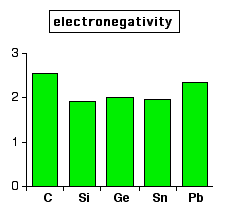 There therefore seems to be no relationship between the non-metal to metal trend and the electronegativity values. Assuming the electronegativity values are correct, I am completely at a loss to understand this! | |
|
Note: The data in this chart again comes from the University of Sheffield's Webelements site. Again, there is an awful lot of variability in the data depending on where you get it from. But in no case that I have found is there any trend to lower electronegativities as you go down the Group. Older data sources give a fall from carbon (2.5) to silicon (1.8), but then give all the other elements in the Group the same value (all 1.8). If anyone reading this has a simple explanation for the lack of correlation between the trend to metallic behaviour and the electronegativity values, could you please contact me via the address on the about this site page. | |
|
Ionisation energies If you are thinking about the formation of positive ions, the obvious place to start looking is how ionisation energies change as you go down Group 4. Ionisation energies are defined as the energy needed to carry out each of the following changes. They are quoted in kJ mol-1. First ionisation energy: Second ionisation energy: . . . and so on. | |
|
Note: If you aren't sure about ionisation energies it would pay you to follow this link before you go any further. Use the BACK button on your browser to return quickly to this page. | |
|
None of the Group 4 elements form 1+ ions, so looking at the first
ionisation energy alone isn't very helpful. Some of the elements do,
however, form 2+ and (to some extent) 4+ ions. The first chart shows how the total ionisation energy needed to form the 2+ ions varies as you go down the Group. The values are all in kJ mol-1. 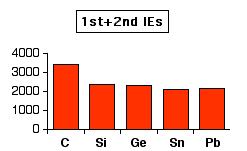
| |
|
Note: The reason for the oddity at lead is discussed in some more detail on a page about the oxidation states shown by elements in Group 4. It isn't particularly important to the present discussion. | |
If you look at the amount of ionisation energy needed to form 4+
ions, the pattern is similar, but not entirely clear cut. Again, the
values are all in kJ mol-1.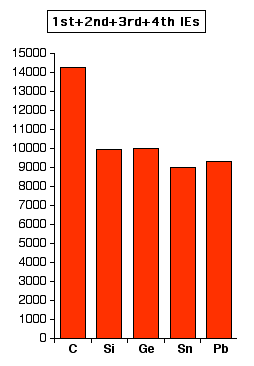 | |
|
Note: The increase in total ionisation energy at lead is even more obvious in the case of the possible formation of 4+ ions. This is important when it comes to looking at the preferred oxidation states of lead. | |
|
What is clear looking at these two charts is that you have to
put in large amounts of ionisation energy to form 2+ ions, and huge
amounts to form 4+ ions. However, in each case there is a fall in ionisation energy as you go down the Group which makes it more likely that tin and lead could form positive ions - however, there is no indication from these figures that they are likely to form positive ions. The ionisation energies of carbon at the top of the Group are so huge that there is no possibility of it forming simple positive ions. | |
Saturday, 5 October 2013
THE TREND FROM NON-METAL TO METAL IN THE GROUP 4 ELEMENTS
Subscribe to:
Post Comments (Atom)


No comments:
Post a Comment